A pervasive dieting mantra is that a cumulative reduction of caloric intake of 3,500 will result in a weight loss of 1 pound. This dieting rule popularly states “because 3,500 calories equals about 1 pound (0.45 kilogram) of fat, if you cut 500 calories from your diet each day, or burn 500 calories extra per day from exercising (or a combination thereof) you’d lose about 1 pound a week (500 calories x 7 days = 3,500 calories) and 52 pounds in a year.

The author obviously knows how to keep her bodyfat to a healthy level year round.
This simple weight loss rule continues to be cited on weight loss websites as well as authoritative nutrition textbooks [1, 2], scientific articles [3-6], and expert guidelines.[7] It is even common among health care professionals to believe in the 3,500 calorie rule [8], and the Patient Page on “Healthy weight loss” at The Journal of the American Medical Association website states in the first sentence on “What you need to know about weight loss” that… “A total of 3,500 calories equals 1 pound of body weight. This means if you decrease (or increase) your intake by 500 calories daily, you will lose (or gain) 1 pound per week (500 calories per day × 7 days = 3,500 calories).” [9]
However, is this really true? Most people who have ever been on a diet are probably skeptical. And rightly so. In this article I will highlight what’s wrong with the 3,500 calorie rule and present a more accurate calculator that you can use to more precisely predict how much weight loss you can except in real life from a given daily calorie reduction.
What’s wrong with the “3,500 calorie per pound weight loss” rule?
The 3,500 calorie rule is based on a calculation – first published 1952 – that assumes exclusive loss of adipose tissue consisting of 87% fat.[10, 11] However, in real life, during weight loss lean body mass is lost together with body fat [12-14] and the composition of weight loss (i.e. the relative proportion of lean and fat) is influenced by several factors, such as exercise [15-17], protein intake [15, 18-20], as well as testosterone [21-23] and thyroid hormone status.[24, 25] And making it even more inaccurate, the original “3,500 calorie per pound weight loss” rule is popularly misrepresented by replacing “weight” with “fat” loss.[26]
The main scientific criticism of 3,500 calorie rule is that in real life, there is self-limiting nature of weight loss imposed by a constant caloric deficit. As you lose weight, your body will progressively burn less calories as your weight drops (more on that below), so that over time – even if you adhere to your caloric restriction – the imposed calorie deficit will have a smaller impact and your rate of weight loss will therefore slow down (unless you restrict your calories more or exercise more).[14, 27-33] To clarify, if you lower intake by 500 kcal on diet day one, this closely approximates an energy deficit of -500 kcal, but the magnitude of this deficit and associated weight loss will decrease markedly over time.
Why? Because when you are in a state of negative energy balance – i.e. when you eat less calories than you burn, or burn more calories than you eat – you will lose not only fat but also calorie consuming lean tissue (primarily muscle mass) [34, 35], metabolic adaptations [31, 36-44], and a reduced calorie cost of moving a lighter body.[27, 32, 39, 45] Because metabolism (i.e. caloric expenditure) declines with loss of body mass [46, 47], your calorie requirements will be reduced after weight loss (unless you exercise more). The reductions can range from 170 to 250 kcal/d for a 10% weight loss and from 325 to 480 for a 20% weight loss.[48, 49]
Thus, although sometimes viewed in isolation, energy intake and expenditure in fact exist in a dynamic interplay: calorie intake influences calorie expenditure (and vice versa).[50]
How to improve predictions of expected weight loss with a diet?
The self-limiting nature of weight loss is best captured by so called thermodynamically-based dynamic models [32, 33] and not by the 3,500-kcal rule. Dynamic weight loss models take into consideration baseline body composition, age, height, gender, and degree of caloric restriction, and result in a curvilinear pattern of weight loss over time rather than the linear pattern predicted by the 3500-kcal rule.
Although dynamic weight loss calculations describing the curvilinear weight loss pattern are far more complex than the simple 3,500 rule, there is a great dynamic energy balance calculator – available for free on the Pennington Biomedical Research Center (PBRC) website – that does the math crunching for you:
www.pbrc.edu/research-and-faculty/calculators/sswcp
Note that this calculator uses the SI unit kcal (kilocalorie), which is the correct way of expressing energy. In daily parlance and lay media, the term “calorie” is used as a synonym for kcal.
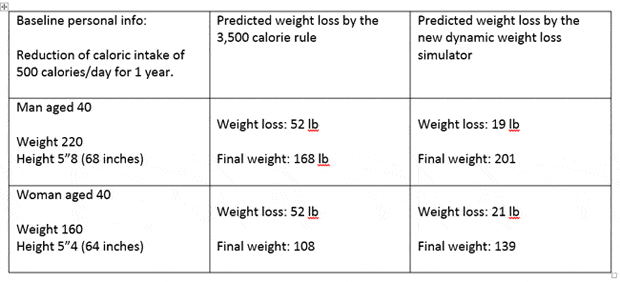
Table 1 illustrates how grossly the 3,500 calorie rule predicts expected weight loss compared to the new dynamic weight loss simulator that takes into account the self-limiting nature of a given caloric deficit.
Table 1: Weight loss prediction using the 3,500 calorie rule vs. the dynamic weight loss simulator.

When running the dynamic weight loss simulator you will see that the 3,500 calorie rule only is valid (at best) for the first month after having started a diet. However, it should be remembered that the “early” rapid weight loss phase may represent a period during which the energy content of weight change is low (because of loss of primarily glycogen and water mass) and thus does not follow the classic “3,500 calorie rule”.[51] This further invalidates it.
Does a dieting 500 calorie restriction per day apply to everybody?
Let’s put aside the 3,500 calorie rule for a moment and ask the question:
“Is a 500 calorie deficit per day a good guideline for everybody who want to lose weight”?
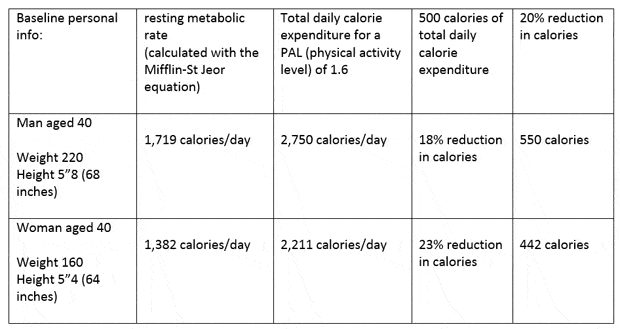
No! Because a man in general is heavier and has more lean mass than a women, and thus has a greater total caloric expenditure for any given physical activity level, 500 calories of his total will be a lower percentage caloric deficit and 500 calories of a woman’s total, as illustrated in table 2.
Table 2: Fixed (e.g. 500 calories) vs. relative (e.g. 20%) caloric reduction during a diet.
There are several equations for calculating resting metabolic rate. While the Harris-Benedict equation is most widely used, several studies show that the Mifflin-St Jeor equation provides a more accurate estimate of actual resting metabolic rate in the largest percentage of non-obese and obese individuals.[52-55] Here is a good free Mifflin-St Jeor calculator (under the advanced options):
www.freedieting.com/tools/calorie_calculator.htm
PAL of 1.6 is typical of people with seated work and requirement to move around but little or no strenuous leisure exercise.[56, 57]
While the differences in this example – 18% vs. 23% and 550 calories vs. 442 calories – are not that large, when comparing with a heavier man with a woman, there will be more marked differences in the fixed vs. relative caloric deficit.
Therefore, instead of imposing a fixed calorie restriction for everybody, it is better to use a percentage of each individual person’s baseline caloric intake (which usually reflects that person’s caloric expenditure if he/she is in body weight/composition steady-state, i.e. is not fluctuating in body weight).
A good rule of thumb for dieting is a 20% calorie deficit.[44] This can be achieved by reducing calories, increasing exercise, or a combination thereof. There is a lot to say about diet vs. exercise induced weight loss, so I will save that for another article. Also, diet composition tremendously impacts the relative loss of body fat vs. lean mass during a diet, as well as improvements in cardio-metabolic risk factors, which is also a topic for another discussion.
Summary
Don’t get fooled by the “3,500 calorie per pound weight loss” rule. When you lose weight on a diet, your energy expenditure gradually declines with the loss of body mass and metabolic adaptations, which means that over time the calorie deficit gets smaller (even if you adhere to your diet and keep your caloric deficit constant). Therefore, unlike the linear weight loss pattern depicted by the 3,500 calorie rule, the actual weight loss follows a smooth curve and then plateaus at the new energy requirement level.
Use the freely available dynamic weight loss calculator to get a realistic weight loss expectation based on your individual caloric reduction and/or increased exercise calorie burning.
Talking about calories, don’t miss Will’s great video addressing the common question:
“Do You NEED To Count Calories?”
———————————————————————————————————————————————–
About Monica Mollica > www.Ageless.Fitness

Monica Mollica holds a Master degree in Nutrition from the University of Stockholm / Karolinska Institue, Sweden. She has also done PhD level course work at renowned Baylor University, TX.
Having lost her father in a lifestyle-induced heart attack at an age of 48, she is a strong advocate of primary prevention and early intervention, and the development of lifestyle habits for health promotion at all ages.
Today, Monica is sharing her solid medical research insights and real-life hands on experience and passion for health and fitness by offering nutrition / supplementation / exercise / health consultation services, and working as a medical writer specializing in health promotion, fitness and anti-aging.
She is currently in the process of writing a book on testosterone, covering health related issues for both men and women.
——————————————————————————————————————–
References:
1. Hill, J.O., V.A. Catenacci, and H.R. Wyatt, Obesity: Etiology, in Modern Nutrition in Health & Disease, M.E. Shils, Editor. 2006, Lippincott Williams & Wilkins. p. 1013-1028.
2. Cheskin, L.J. and K.H. Poddar, Obesity Management, in Modern Nutrition in Health & Disease, A.C.e.a. Ross, Editor. 2014, Lippincott Williams & Wilkins. p. 786-789.
3. Astrup, A., Dietary approaches to reducing body weight. Baillieres Best Pract Res Clin Endocrinol Metab, 1999. 13(1): p. 109-20.
4. Wolfe, R.R., The underappreciated role of muscle in health and disease. Am J Clin Nutr, 2006. 84(3): p. 475-82.
5. Byrne, N.M., et al., Weight loss strategies for obese adults: personalized weight management program vs. standard care. Obesity (Silver Spring), 2006. 14(10): p. 1777-88.
6. Freij, M.Y., et al., Modeling potential effects of reduced calories in kids’ meals with toy giveaways. Child Obes, 2014. 10(1): p. 58-63.
7. American Heart Association, Understanding Childhood Obesity, in American Heart Association Sourcebook. 2005.
8. Abdel-Hamid, T., et al., Public and health professionals’ misconceptions about the dynamics of body weight gain/loss. Syst Dyn Rev, 2014. 30(1-2): p. 58-74.
9. Guth, E., JAMA patient page. Healthy weight loss. Avaliable at http://jama.jamanetwork.com/article.aspx?articleid=1900513 Accessed July 13, 2015. JAMA, 2014. 312(9): p. 974.
10. Wishnofsky, N., Caloric equivalents of gained or lost weight. Metabolism, 1952. 1(6): p. 554-5.
11. Wishnofsky, M., Caloric equivalents of gained or lost weight. Am J Clin Nutr, 1958. 6(5): p. 542-6.
12. Forbes, G.B., Lean body mass-body fat interrelationships in humans. Nutr Rev, 1987. 45(8): p. 225-31.
13. Forbes, G.B., Body fat content influences the body composition response to nutrition and exercise. Ann N Y Acad Sci, 2000. 904: p. 359-65.
14. Hall, K.D., Body fat and fat-free mass inter-relationships: Forbes’s theory revisited. Br J Nutr, 2007. 97(6): p. 1059-63.
15. Stiegler, P. and A. Cunliffe, The role of diet and exercise for the maintenance of fat-free mass and resting metabolic rate during weight loss. Sports Med, 2006. 36(3): p. 239-62.
16. Weinheimer, E.M., L.P. Sands, and W.W. Campbell, A systematic review of the separate and combined effects of energy restriction and exercise on fat-free mass in middle-aged and older adults: implications for sarcopenic obesity. Nutr Rev, 2010. 68(7): p. 375-88.
17. Washburn, R.A., et al., Does the method of weight loss effect long-term changes in weight, body composition or chronic disease risk factors in overweight or obese adults? A systematic review. PLoS One, 2014. 9(10): p. e109849.
18. Phillips, S.M. and M.B. Zemel, Effect of protein, dairy components and energy balance in optimizing body composition. Nestle Nutr Inst Workshop Ser, 2011. 69: p. 97-108; discussion 108-13.
19. Hector, A.J., et al., Whey protein supplementation preserves postprandial myofibrillar protein synthesis during short-term energy restriction in overweight and obese adults. J Nutr, 2015. 145(2): p. 246-52.
20. Verreijen, A.M., et al., A high whey protein-, leucine-, and vitamin D-enriched supplement preserves muscle mass during intentional weight loss in obese older adults: a double-blind randomized controlled trial. Am J Clin Nutr, 2015. 101(2): p. 279-86.
21. Heufelder, A.E., et al., Fifty-two-week treatment with diet and exercise plus transdermal testosterone reverses the metabolic syndrome and improves glycemic control in men with newly diagnosed type 2 diabetes and subnormal plasma testosterone. J Androl, 2009. 30(6): p. 726-33.
22. Kelly, D.M. and T.H. Jones, Testosterone and obesity. Obes Rev, 2015.
23. Traish, A.M., Testosterone and weight loss: the evidence. Curr Opin Endocrinol Diabetes Obes, 2014. 21(5): p. 313-22.
24. Mullur, R., Y.Y. Liu, and G.A. Brent, Thyroid hormone regulation of metabolism. Physiol Rev, 2014. 94(2): p. 355-82.
25. Laurberg, P., et al., Thyroid function and obesity. Eur Thyroid J, 2012. 1(3): p. 159-67.
26. Thomas, D.M., et al., Time to correctly predict the amount of weight loss with dieting. J Acad Nutr Diet, 2014. 114(6): p. 857-61.
27. Chow, C.C. and K.D. Hall, The dynamics of human body weight change. PLoS Comput Biol, 2008. 4(3): p. e1000045.
28. Hall, K.D., Computational model of in vivo human energy metabolism during semistarvation and refeeding. Am J Physiol Endocrinol Metab, 2006. 291(1): p. E23-37.
29. Hall, K.D. and P.N. Jordan, Modeling weight-loss maintenance to help prevent body weight regain. Am J Clin Nutr, 2008. 88(6): p. 1495-503.
30. Hall, K.D., What is the required energy deficit per unit weight loss? Int J Obes (Lond), 2008. 32(3): p. 573-6.
31. Hall, K.D., Predicting metabolic adaptation, body weight change, and energy intake in humans. Am J Physiol Endocrinol Metab, 2010. 298(3): p. E449-66.
32. Thomas, D.M., et al., A Simple Model Predicting Individual Weight Change in Humans. J Biol Dyn, 2011. 5(6): p. 579-599.
33. Hall, K.D., et al., Quantification of the effect of energy imbalance on bodyweight. Lancet, 2011. 378(9793): p. 826-37.
34. Bosy-Westphal, A., et al., Issues in characterizing resting energy expenditure in obesity and after weight loss. Front Physiol, 2013. 4: p. 47.
35. Muller, M.J., et al., Functional body composition and related aspects in research on obesity and cachexia: report on the 12th Stock Conference held on 6 and 7 September 2013 in Hamburg, Germany. Obes Rev, 2014. 15(8): p. 640-56.
36. Prentice, A.M., et al., Physiological responses to slimming. Proc Nutr Soc, 1991. 50(2): p. 441-58.
37. Goele, K., et al., Influence of changes in body composition and adaptive thermogenesis on the difference between measured and predicted weight loss in obese women. Obes Facts, 2009. 2(2): p. 105-9.
38. Muller, M.J. and A. Bosy-Westphal, Adaptive thermogenesis with weight loss in humans. Obesity (Silver Spring), 2013. 21(2): p. 218-28.
39. Leibel, R.L., M. Rosenbaum, and J. Hirsch, Changes in energy expenditure resulting from altered body weight. N Engl J Med, 1995. 332(10): p. 621-8.
40. Tremblay, A., et al., Adaptive thermogenesis can make a difference in the ability of obese individuals to lose body weight. Int J Obes (Lond), 2013. 37(6): p. 759-64.
41. Major, G.C., et al., Clinical significance of adaptive thermogenesis. Int J Obes (Lond), 2007. 31(2): p. 204-12.
42. Rosenbaum, M., et al., Effects of changes in body weight on carbohydrate metabolism, catecholamine excretion, and thyroid function. Am J Clin Nutr, 2000. 71(6): p. 1421-32.
43. Rosenbaum, M., et al., Long-term persistence of adaptive thermogenesis in subjects who have maintained a reduced body weight. Am J Clin Nutr, 2008. 88(4): p. 906-12.
44. Heilbronn, L.K., et al., Effect of 6-month calorie restriction on biomarkers of longevity, metabolic adaptation, and oxidative stress in overweight individuals: a randomized controlled trial. JAMA, 2006. 295(13): p. 1539-48.
45. Thomas, D.M., et al., A computational model to determine energy intake during weight loss. Am J Clin Nutr, 2010. 92(6): p. 1326-31.
46. Heyman, M.B., et al., Underfeeding and body weight regulation in normal-weight young men. Am J Physiol, 1992. 263(2 Pt 2): p. R250-7.
47. Jebb, S.A., et al., Changes in macronutrient balance during over- and underfeeding assessed by 12-d continuous whole-body calorimetry. Am J Clin Nutr, 1996. 64(3): p. 259-66.
48. Hill, J.O., J.C. Peters, and H.R. Wyatt, Using the energy gap to address obesity: a commentary. J Am Diet Assoc, 2009. 109(11): p. 1848-53.
49. Hill, J.O., Can a small-changes approach help address the obesity epidemic? A report of the Joint Task Force of the American Society for Nutrition, Institute of Food Technologists, and International Food Information Council. Am J Clin Nutr, 2009. 89(2): p. 477-84.
50. Economos, C.D., et al., Food and Physical Activity Environments: An Energy Balance Approach for Research and Practice. Am J Prev Med, 2015. 48(5): p. 620-629.
51. Heymsfield, S.B., et al., Energy content of weight loss: kinetic features during voluntary caloric restriction. Metabolism, 2012. 61(7): p. 937-43.
52. Frankenfield, D.C., et al., Validation of several established equations for resting metabolic rate in obese and nonobese people. J Am Diet Assoc, 2003. 103(9): p. 1152-9.
53. Frankenfield, D., L. Roth-Yousey, and C. Compher, Comparison of predictive equations for resting metabolic rate in healthy nonobese and obese adults: a systematic review. J Am Diet Assoc, 2005. 105(5): p. 775-89.
54. Weijs, P.J., Validity of predictive equations for resting energy expenditure in US and Dutch overweight and obese class I and II adults aged 18-65 y. Am J Clin Nutr, 2008. 88(4): p. 959-70.
55. Ruiz, J.R., et al., Validity of resting energy expenditure predictive equations before and after an energy-restricted diet intervention in obese women. PLoS One, 2011. 6(9): p. e23759.
56. Black, A.E., et al., Human energy expenditure in affluent societies: an analysis of 574 doubly-labelled water measurements. Eur J Clin Nutr, 1996. 50(2): p. 72-92.
57. Shetty, P., Energy requirements of adults. Public Health Nutr, 2005. 8(7A): p. 994-1009.


Your points are well taken and I absolutely believe them, but your two tools demonstrate massively different assumptions – both wrong. I.e. If I use the Excel sheet thing and input the maintenance calories given by the second tool it shows massive weight loss. Wish is was correct, but obviously VERY far off! Now, if I take the difference between maintenance calories and fat loss calories (462) the Excel graph shows just about exactly what my weight actually did during my last massive diet. Unfortunately, in real life that would have meant my maintenance level was about 300 less than predicted and would have assumed no exercise when I actually was doing a lot. I guess all these equations are really off when you start with an pretty obese body fat content but not so obese weight….
You misunderstood. The 2nd tool only estimates your resting metabolic rate (RMR).
You have to multiply your RMR with your PAL (physical activity level).
Well maybe I wasn’t clear. I’m 6’2″ and went through a dieting effort about two years ago starting at 280 lbs. I lost a fair amount of weight over 8 months by eating around 1700-1800 calories per day (carefully tracked) and working out 4 times per week.
The second tool DOES allow you to input how much exercise you’re doing – little or no, 2/week, etc. Using it and assuming little or no exercise gave me a maintenance calorie of 2311, a fat loss of 1849 and and extreme fat loss of 1736. The weight loss predicted by the first tool at the 2311 calories actually somewhat follows what I experienced, yet I was actually eating 1800 and working out the 4x/week rather than eating the 2311 and doing little or none. If I had multiplied by a PAL as you suggested or used the 4x/week option in the second tool it would have come up with a much higher calorie intake number and if I had followed that I would definitely gained weight, not lost it.
The first tool is just off on what it thinks you need for calories – i.e. if I use daily intense in the second tool I get 3150 calories maintenance and the first tool STILL shows some weight loss. If I’d have been eating 3150 calories/day I’d have been gaining 2 lbs/week at least!
I’d guess this would be related to no significant non-workout activities and a much higher than expected body fat content at the weight I was at. I.e. I’m currently down around 215 but my %BF is still over 25%.
All this being said, however, the points you make that dropping 3500 calories per week from whatever IS a maintenance level for you will initially show weight loss but you will slowly see that stop as your body adjusts and seeks a new homeostasis due in part to the new lower weight you’ve reached.
I agree with William. There is something wrong with the values being used for Basic Metabolic Rate in the Java tool.
I have found that cronometer.com is a great tool for tracking your calorie intake and weight management/reduction. The calculations for BMR use the above recommended method. Easy to use and a larger than most database of food products.
Ok, this model is VERY interesting and begs a question.
Using the java program, and the example of the woman above, if you run her out 4 years at 1800 calories, in the end she starts a slow weight gain – rather than simply a plateau at the end of the process.
Is this real, or just an artifact of the program?
What would be the cause of this eventual gain?
What would be the solution?